Remote sensing / GIS

Mutation Signalling on agriculture parcels in the Netherlands

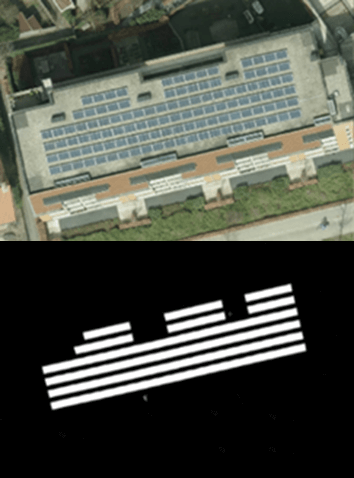
Agriculture parcel boundaries change continuously through time. Monitoring, based on satellite imagery in combination with artificial intelligence, aims to detect changes in the boundaries of the parcels.

Agriculture; crop acreage; Monitor crops; crop types extent; Land use; Assess land value, ownership, type, use

Product Description

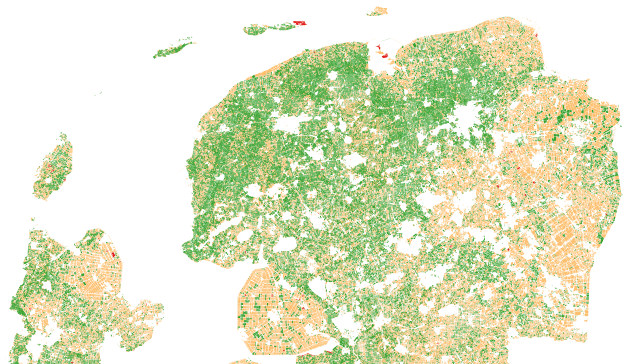
NEO signals changes to agriculture parcels. Monitoring, based on satellite imagery in combination with artificial intelligence, aims to detect changes in the boundaries of the parcels. The service saves time and money because, based on the mutation signalling, parcels can be looked at more specifically to determine the new parcel boundaries. This supports the process of keeping the national LPIS (Land Parcel Identification System) registry up to date. The service that NEO provides is unique: it is the first time that mutation signalling based on earth observation is performed automatically on this scale. In this way the 500.000 parcels in the Netherlands are monitored. Open data from the national satellite data portal in the Netherlands is used.

Service Language
English
Metadata Language
English
Service Level Agreement
Terms & Conditions
Licence
Delivery Mode
Commercial level
Commercial
Service Life Cycle Status
Scale
National level
Service Locator
Date of Publication
24 Dec 2019

Benefits

The service supports the process of keeping the LPIS registry up to date in an efficient manner.

  • Saves money
  • Saves time
  • Up-to-date
  • Large scale
  • Consistent
  • Supports agricultural monitoring and precision farming
Payment Model
Price starting from

Technical Specification

OpenSource
Licence type
Licence duration

Service place

Currently the Netherlands

Compare products

0 products added

Compare

Services comparison

services

Related Content

Solar panel service
Infrastructure, Map and monitor solar energy (solar farms), solar energy, solar radiation, Monitor urban areas, Urban Areas, urban development, urban settlement, urban atlas, urban areas, smart cities, individual houses inventory, Alternative Energy, Regional planners, Solar energy, Environment, Real-estate management
NEO monitors solar panels throughout the Netherlands using deep learning methods. Solar panels are detected using various resolutions of satellite and aerial imagery. The panels are digitalized by the algorithm and related to 3D-roofs based on the AHN (Dutch national height model) to calculate zenith and azimuth angles. This data, combined with data such as solar power, allows NEO to estimate the power output for each object. Solar panels are also provided with parcel and address information and statistical reports, so customers can easily apply the data and relate it to internal registrations.
Added
Added
Monitoring trees
Forests, Assess Deforestation / Forest Degradation, Assess forest damage due to storms or insects, Monitor forest resources, Land use, Forestry, Forest policy, Forest policy makers, Logging industry, Wood industry
NEO is monitoring trees using satellite data and deep learning methodologies. This service informs people about the status of different trees species in their surrounding/municipality. Trees managed by municipalities can be checked on presence and correct attributes such as tree height.
Added
Added
EO based phytoplankton biomass service
Inland Water, Assess and monitor water bodies   , Local and regional planners, Regional governments, City authorities, Environment, Utilities (water, electricity, waste) , Water plants, Coastal management agencies
Using knowledge about how certain substances, such as one of the main pigments of the phytoplankton (Chlorophyll a - Chl a) alter the colour of the water, these parameters can be derived from optial Earth Observation (EO) satellite sensors. Water Insight provides monitoring services of Chl a based on EO data which is validated with in situmeasurements. Also the maps of WFD phytoplankton biomass status classes are created, by application of the WFD tresholds on Chl a as a proxy for phytoplankton biomass. The maps are made available in a portal, which allows to follow the lakes in time, zoom and download maps and time series.
Added
Added
5D Multi-Purpose LIS (Land information System)
Agriculture, Infrastructure, Coastal, Floods, Forests, Inland Water, Land Ecosystems, Land use, Landslides, Sea-ice and icebergs, Snow & Ice, Topography, Urban Areas, Security, Assess Environmental impact of farming, Monitor crops, Assess Deforestation / Forest Degradation, Assess environmental impact of forestry, Assess and monitor water bodies   , Monitor land ecosystems and biodiversity, Monitor land cover and detect change , Baseline mapping , Map line of sight visibility (land surface), Asset infrastructure monitoring, Monitor coastal ecosystem, Monitor the coast line, Map and assess flooding, Detect and monitor wildfires, Forecast and assess landslides, Monitor sensitive risk areas, Forecasting epidemics and diseases, land administration, land use studies, monitoring of settlements, urban atlas, urban development, smart cities, rural areas, building inventory, building footprint, spatial planning, land cover, Solar energy, Construction, Forestry, Real-estate management, Transportation
The complexity of modern urban environments has led to the introduction of 3D Land Information Systems (LISs), which tend to replace traditional 2D LIS architectures for the purposes of urban planning and regeneration, land administration, real estate management and civil development. Both the need for 3D visualization of the geometry of buildings in various time instances through the years and the need for acquisition of 3D models in various levels of detail (LoDs), which not only fulfill the requirements of the various users but also they speed up the visualization process, are obvious. Thus, additional dimensions, that is, for time and scale, need to be supported by a modern LIS. This service introduces a 5D modelling pipeline that may be adopted by a multi-purpose LIS for the selective creation of 3D models of an urban area in various time instances and at various LoDs, enriched with cadastral and other spatial data. The methodology is based on automatic change detection algorithms for spatial-temporal analysis of the spatial changes that took place in subsequent time periods, using image orientation, dense image matching and structure from motion algorithms, the procedure requires photogrammetric stereo plotting, implements procedural modelling and relies on the availability of overlapping aerial and terrestrial imagery, ground control points and cadastral information.
Added
Added