Success story

Renovatio shows significance of Cultural Heritage on Property values

Urban Areas; Infrastructure

Rotterdam map by Cittmap

Profile

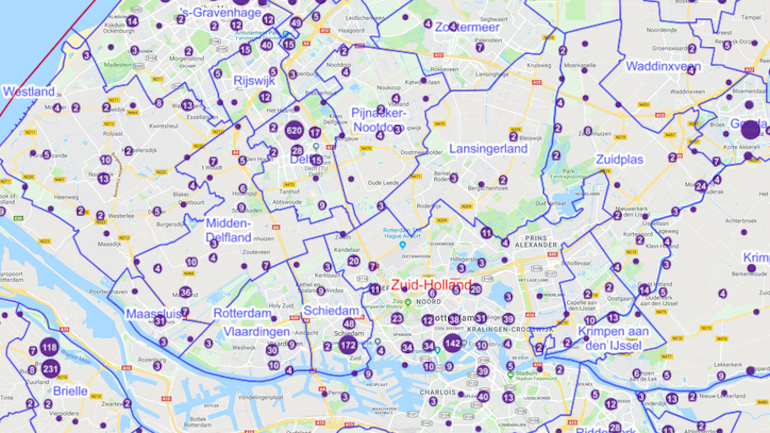
South Holland is a province of the Netherlands situated on the North Sea in the west of the Netherland and covers an area of 3,403 km2. Its provincial capital is The Hague and its largest city is Rotterdam. With a population of 3.65 million, South Holland is the most populous province and one of the most worlds’s densely populated ares.

Proposal

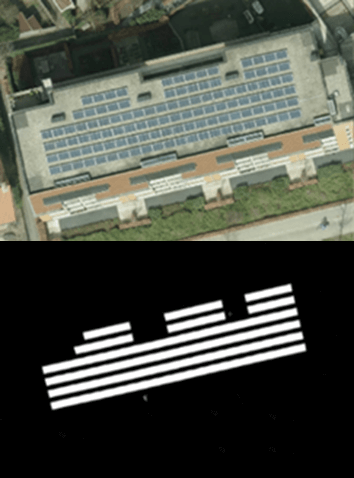
The province of Zuid Holland had a challenge with 15% of the monument buildings being empty. This causes reduction in property prices and loss of cultural heritage. The renovation charges exceeded 150million, and a strategy was required to choose the correct sites for redevelopment. The data driven strategy proposed a solution to make life easier for the department culture and heritage to reduce the number of empty monuments.

Benefits

  • The major advantage is the availability of information quickly.
  • The information also allowed for identifying risk with renovation projects much earlier.
  • These benefits enable more projects starting and by measuring the community benefits, the department is able to test strategies better.
  • Saves time to find information + Reduce risk with real estate projects = Confident decision making

Compare products

0 products added

Compare

Services comparison

services

Related Content

Renovatio
Land use, Topography, Urban Areas, Land Ecosystems, Environmental, Pollution & Climate, Local and regional planners
Renovatio is a data driven decision support system for real estate sector. It helps users to find information about the building, and neighbourhood to reduce time to research information, and better estimate risk in projects.
Added
Added
Solar panel service
Infrastructure, Map and monitor solar energy (solar farms), solar energy, solar radiation, Monitor urban areas, Urban Areas, urban development, urban settlement, urban atlas, urban areas, smart cities, individual houses inventory, Alternative Energy, Regional planners, Solar energy, Environment, Real-estate management
NEO monitors solar panels throughout the Netherlands using deep learning methods. Solar panels are detected using various resolutions of satellite and aerial imagery. The panels are digitalized by the algorithm and related to 3D-roofs based on the AHN (Dutch national height model) to calculate zenith and azimuth angles. This data, combined with data such as solar power, allows NEO to estimate the power output for each object. Solar panels are also provided with parcel and address information and statistical reports, so customers can easily apply the data and relate it to internal registrations.
Added
Added
Land Cover Analysis
Floods, Inland Water, Land Ecosystems, Geology, Forests, Infrastructure, Land use, Urban Areas, Fires, Earthquakes, Construction, Emergency Services, Environmental, Pollution & Climate, Farming, Utilities (water, electricity, waste) , Oil and Gas, Minerals and Mining
LCA stands for Land Cover Analysis and is used to provide an up to date, digital overview of what covers the surface of our earth split out into 10 key land cover classes. The LCA is often the first step in many environmental monitoring or site selection processes.
Added
Added
5D Multi-Purpose LIS (Land information System)
Agriculture, Infrastructure, Coastal, Floods, Forests, Inland Water, Land Ecosystems, Land use, Landslides, Sea-ice and icebergs, Snow & Ice, Topography, Urban Areas, Security, Assess Environmental impact of farming, Monitor crops, Assess Deforestation / Forest Degradation, Assess environmental impact of forestry, Assess and monitor water bodies   , Monitor land ecosystems and biodiversity, Monitor land cover and detect change , Baseline mapping , Map line of sight visibility (land surface), Asset infrastructure monitoring, Monitor coastal ecosystem, Monitor the coast line, Map and assess flooding, Detect and monitor wildfires, Forecast and assess landslides, Monitor sensitive risk areas, Forecasting epidemics and diseases, land administration, land use studies, monitoring of settlements, urban atlas, urban development, smart cities, rural areas, building inventory, building footprint, spatial planning, land cover, Solar energy, Construction, Forestry, Real-estate management, Transportation
The complexity of modern urban environments has led to the introduction of 3D Land Information Systems (LISs), which tend to replace traditional 2D LIS architectures for the purposes of urban planning and regeneration, land administration, real estate management and civil development. Both the need for 3D visualization of the geometry of buildings in various time instances through the years and the need for acquisition of 3D models in various levels of detail (LoDs), which not only fulfill the requirements of the various users but also they speed up the visualization process, are obvious. Thus, additional dimensions, that is, for time and scale, need to be supported by a modern LIS. This service introduces a 5D modelling pipeline that may be adopted by a multi-purpose LIS for the selective creation of 3D models of an urban area in various time instances and at various LoDs, enriched with cadastral and other spatial data. The methodology is based on automatic change detection algorithms for spatial-temporal analysis of the spatial changes that took place in subsequent time periods, using image orientation, dense image matching and structure from motion algorithms, the procedure requires photogrammetric stereo plotting, implements procedural modelling and relies on the availability of overlapping aerial and terrestrial imagery, ground control points and cadastral information.
Added
Added