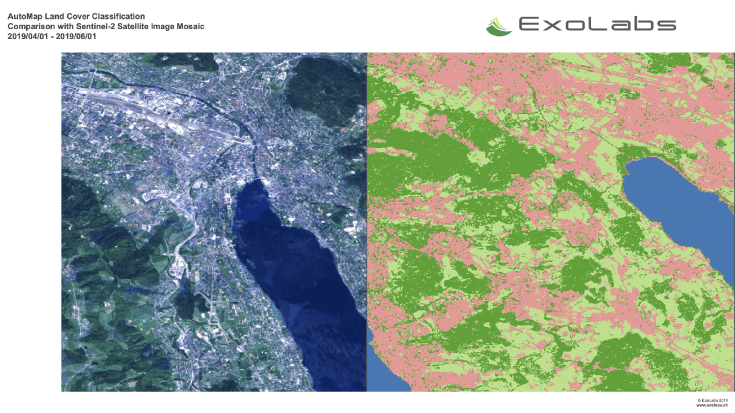
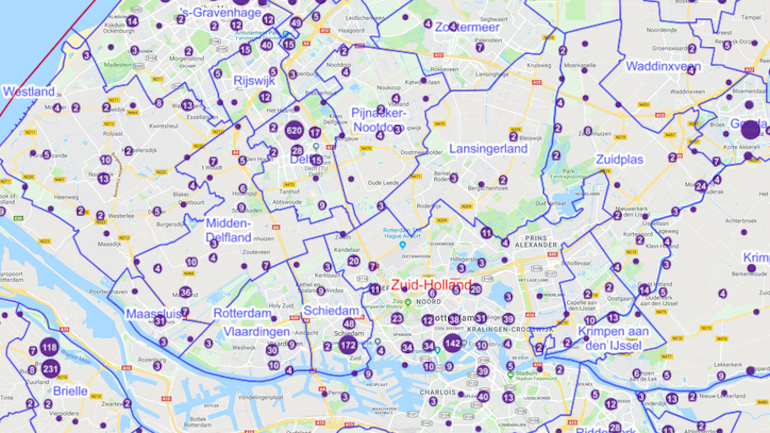
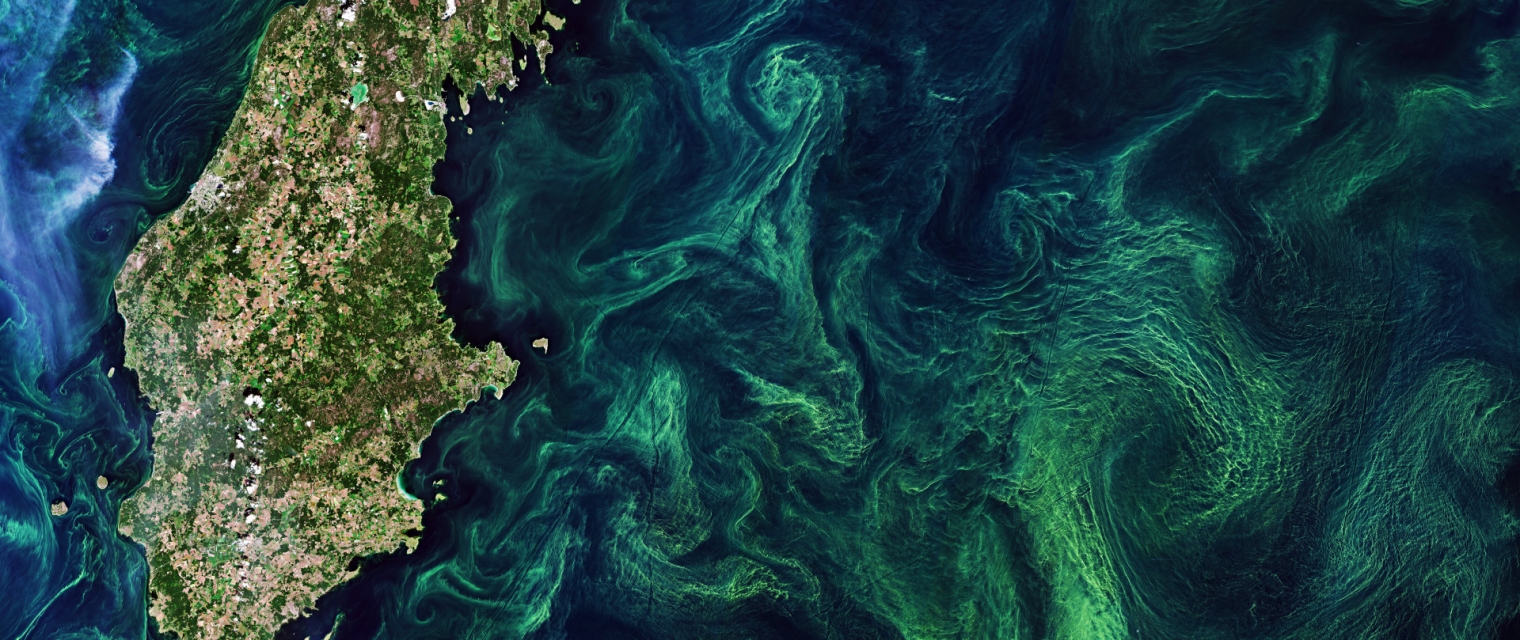
5D Multi-Purpose LIS (Land information System) Agriculture, Infrastructure, Coastal, Floods, Forests, Inland Water, Land Ecosystems, Land use, Landslides, Sea-ice and icebergs, Snow & Ice, Topography, Urban Areas, Security, Assess Environmental impact of farming, Monitor crops, Assess Deforestation / Forest Degradation, Assess environmental impact of forestry, Assess and monitor water bodies , Monitor land ecosystems and biodiversity, Monitor land cover and detect change , Baseline mapping , Map line of sight visibility (land surface), Asset infrastructure monitoring, Monitor coastal ecosystem, Monitor the coast line, Map and assess flooding, Detect and monitor wildfires, Forecast and assess landslides, Monitor sensitive risk areas, Forecasting epidemics and diseases, land administration, land use studies, monitoring of settlements, urban atlas, urban development, smart cities, rural areas, building inventory, building footprint, spatial planning, land cover, Solar energy, Construction, Forestry, Real-estate management, Transportation
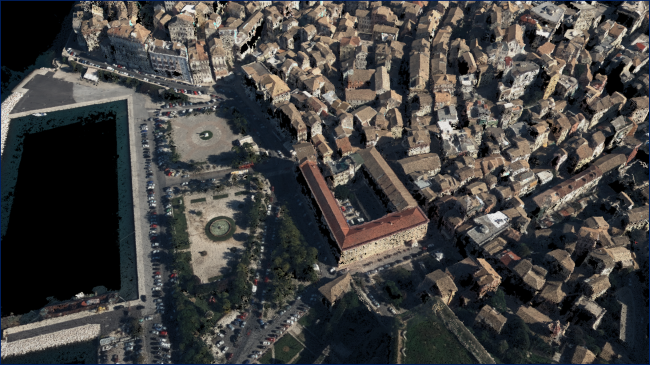
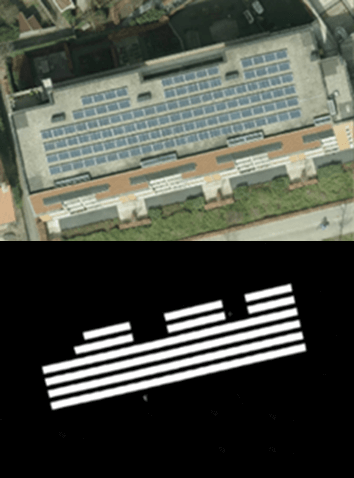
The complexity of modern urban environments has led to the introduction of 3D Land Information Systems (LISs), which tend to replace traditional 2D LIS architectures for the purposes of urban planning and regeneration, land administration, real estate management and civil development. Both the need for 3D visualization of the geometry of buildings in various time instances through the years and the need for acquisition of 3D models in various levels of detail (LoDs), which not only fulfill the requirements of the various users but also they speed up the visualization process, are obvious. Thus, additional dimensions, that is, for time and scale, need to be supported by a modern LIS. This service introduces a 5D modelling pipeline that may be adopted by a multi-purpose LIS for the selective creation of 3D models of an urban area in various time instances and at various LoDs, enriched with cadastral and other spatial data. The methodology is based on automatic change detection algorithms for spatial-temporal analysis of the spatial changes that took place in subsequent time periods, using image orientation, dense image matching and structure from motion algorithms, the procedure requires photogrammetric stereo plotting, implements procedural modelling and relies on the availability of overlapping aerial and terrestrial imagery, ground control points and cadastral information.