Company

Latitudo40

We bring together data and AI algorithms from multiple sources and provide straightforward information to understand our planet from above. Our motto is “Earth Analytics made Simple“.

About

Founded in 2017 by 4 space industry experts and image analysis gurus, Latitudo 40 has combined the 20 years of experience of the “aged” founders to the multidisciplinary and young team which has grown to over 10 people. The team has now artificial intelligence, machine learning, image processing experts, UIX specialists and business development professionals. Our vision is to give easy access to satellite images for everyone. Every day we put our passion in creating new tools that allow people to monitor the earth, with the skills and knowledge you need to read an email or post your pictures on social networks. With all this information at your fingertips, you can make better and faster decisions to support your activities and have a positive impact on your daily process. From infrastructure monitoring, to precision agriculture and emergency response, we believe that understanding the pace of world changes will help to change it, in the right direction.

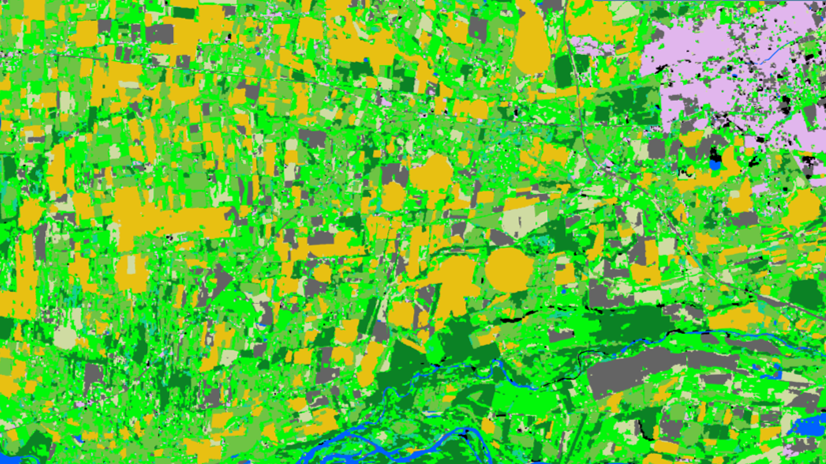
Agriculture; Climate; Floods; Infrastructure; Land Ecosystems; Land use

Certifcation
Registration Number
08702381214
Address
Via Gianturco 31/c 80142 Naples
Telephone
+390816331136
Fax
Contact Name
Gaetano Volpe
Contact Position
CEO
Contact Telephone
+39 081 6331136
Contact Email
gaetano.volpe@latitudo40.com
Value chain
  • Value added services
HQ location
Via Gianturco 31/C NAPLES

Compare products

0 products added

Compare

Services comparison

services

Related Content

Land Cover Analysis
Floods, Inland Water, Land Ecosystems, Geology, Forests, Infrastructure, Land use, Urban Areas, Fires, Earthquakes, Construction, Emergency Services, Environmental, Pollution & Climate, Farming, Utilities (water, electricity, waste) , Oil and Gas, Minerals and Mining
LCA stands for Land Cover Analysis and is used to provide an up to date, digital overview of what covers the surface of our earth split out into 10 key land cover classes. The LCA is often the first step in many environmental monitoring or site selection processes.
Added
Added
5D Multi-Purpose LIS (Land information System)
Agriculture, Infrastructure, Coastal, Floods, Forests, Inland Water, Land Ecosystems, Land use, Landslides, Sea-ice and icebergs, Snow & Ice, Topography, Urban Areas, Security, Assess Environmental impact of farming, Monitor crops, Assess Deforestation / Forest Degradation, Assess environmental impact of forestry, Assess and monitor water bodies   , Monitor land ecosystems and biodiversity, Monitor land cover and detect change , Baseline mapping , Map line of sight visibility (land surface), Asset infrastructure monitoring, Monitor coastal ecosystem, Monitor the coast line, Map and assess flooding, Detect and monitor wildfires, Forecast and assess landslides, Monitor sensitive risk areas, Forecasting epidemics and diseases, land administration, land use studies, monitoring of settlements, urban atlas, urban development, smart cities, rural areas, building inventory, building footprint, spatial planning, land cover, Solar energy, Construction, Forestry, Real-estate management, Transportation
The complexity of modern urban environments has led to the introduction of 3D Land Information Systems (LISs), which tend to replace traditional 2D LIS architectures for the purposes of urban planning and regeneration, land administration, real estate management and civil development. Both the need for 3D visualization of the geometry of buildings in various time instances through the years and the need for acquisition of 3D models in various levels of detail (LoDs), which not only fulfill the requirements of the various users but also they speed up the visualization process, are obvious. Thus, additional dimensions, that is, for time and scale, need to be supported by a modern LIS. This service introduces a 5D modelling pipeline that may be adopted by a multi-purpose LIS for the selective creation of 3D models of an urban area in various time instances and at various LoDs, enriched with cadastral and other spatial data. The methodology is based on automatic change detection algorithms for spatial-temporal analysis of the spatial changes that took place in subsequent time periods, using image orientation, dense image matching and structure from motion algorithms, the procedure requires photogrammetric stereo plotting, implements procedural modelling and relies on the availability of overlapping aerial and terrestrial imagery, ground control points and cadastral information.
Added
Added
Land and Land Cover Analysis
Agriculture, Infrastructure, Land Ecosystems, Land use, Farming, Insurance & Finance, Local and regional planners
With AutoMap, the handling of satellite images has never been easier! We simplify the production of maps based on earth observation data and handle the application of machine learning algorithms for land surface classifications by providing a solid data processing pipeline in a fully managed cloud infrastructure. Bring your own samples or use our default solution, while we take care of the thousands of images that fit your request, all the clouds in your area of interest and every aspect of process optimization and secure data storage. Don't worry about machine learning concepts, intelligent training data collection, hyperparameter optimization or informative feature spaces - That's our job as well! Seeing the world from above is now as demanding as ordering a pizza!
Added
Added
Solar panel service
Infrastructure, Map and monitor solar energy (solar farms), solar energy, solar radiation, Monitor urban areas, Urban Areas, urban development, urban settlement, urban atlas, urban areas, smart cities, individual houses inventory, Alternative Energy, Regional planners, Solar energy, Environment, Real-estate management
NEO monitors solar panels throughout the Netherlands using deep learning methods. Solar panels are detected using various resolutions of satellite and aerial imagery. The panels are digitalized by the algorithm and related to 3D-roofs based on the AHN (Dutch national height model) to calculate zenith and azimuth angles. This data, combined with data such as solar power, allows NEO to estimate the power output for each object. Solar panels are also provided with parcel and address information and statistical reports, so customers can easily apply the data and relate it to internal registrations.
Added
Added