Mapping, Monitoring

Satellite-derived Bathymetry

Satellite-derived bathymetry is a state-of-the-art method for detailed mapping of shallow coastal areas, where unlike field-based surveys this solution has a quick turnaround, no health and safety issues and requires no permits. Since it is based on satellite information it is also ideal for remote areas and harsh environments. The method is able to map water depth down to 8 m at high and low tide in 2m, 10m and 90m resolution, depending on your project requirements.

Coastal; Fisheries; Map water depth or charting; Oil and Gas; Maritime

Description du produit

A cost-effective method for accurate water depth mapping of the worlds shallow coastal areas based on high resolution satellite images. The method is globally applicable.

Langue de service
English
Langue des métadonnées
English
Contrat de niveau de service
A dedicated EULA must be accepted
termes et conditions
Mode de livraison
  • ftp, email download
Niveau commercial
Commercial
Statut du cycle de vie du service
Production
Échelle
Global
Localisateur de service
Date de publication
01 janv. 2017

Avantages

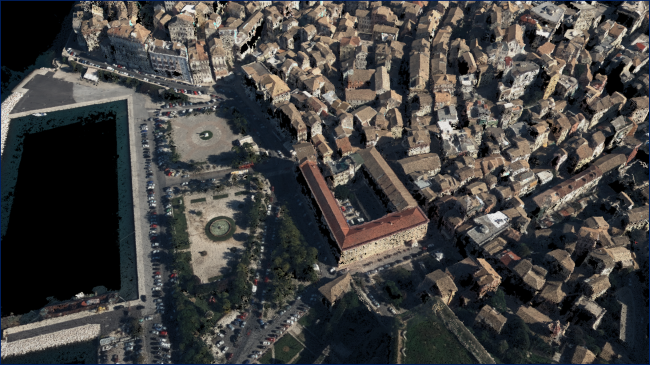
The coastal zone and shallow off-shore areas are some of the most dynamic regions around the world with constantly changing geography. Monitoring and mapping these coastal environments is therefore critical to environmental studies, construction activities such as harbours and pipelines as well as other critical infrastructure

Modèle de paiement
Pay-as-you-go
Prix à partir de
from 2600 €. 2m: 100 88,6 €/sqkm, 10m: 8,9 €/sqkm

Spécifications techniques

Résolution spatiale livrable
2.0 - 10.0 m
Précision livrable verticale
10% depth of water column +/- 0.5m vertical accuracy (LE90)
Précision livrable horizontale
2m/10m CE90 horizontal accuracy
Couches raster livrables
  • 2 layers: water depth map + quality layer
Couches vectorielles livrables
  • Depth contour
Précision livrable
 10 – 20% of depth
Les formats
  • XYZ ASCII, GeoTIFF or any other format
Modèle de données livrable
Global
Données livrables
WGS84 & Geoid
Traducteur de données
Date de début de l'acquisition
Date de fin de l'acquisition
Statut

Lieu de service

Global

55.665186,12.557344

Comparer les produits

0 produits ajoutés

Comparer

Comparaison de services

prestations de service

Contenu connexe

WindSight
Mapping the requirements and the willingness to pay for data at different stages of land based wind farm planning. Establish co-creation cycles with end users from the wind energy industry. Develop a sustainable business case for the provisioning of EO data and derived products over land to the wind energy industry.
Ajoutée
Ajoutée
Earth Science Data Access and PrOcessing Service for Black Sea (ESPOSS)
Coastal, Marine ecosystem, algal bloom, ocean colour compositte, sea surface temperature, turbidity, chlorophyll-a concentration, Maritime, Local and regional planners
EPSOSS takes advantage of the high investments made by the European countries and their international partners in ES data collection and dissemination systems (e.g. satellites, in-situ networks, ICT frameworks) and builds on top of those systems an added value application (geoportal) for the scientific community and the Black Sea relevant decision makers on environmental issues. ESPOSS offers: - Friendly interface - easy to use graphical user interface and intuitive workflows. - 10 000+ satellite derived data layers - the product portfolio includes: Sea surface temperature, chlorophyll concentration, diffuse attenuation coefficient, total suspended matter, etc. - Modern architecture - ESPOSS architecture design is driven by service-oriented architecture design principles, and use open standards from IETF, W3C, OASIS, ISO/TC 211, and OGC. - Open source based - ESPOSS GeoPortal is built completely with free and open source software. - Modular and scalable - the geoportal is based on a modular and scalable software architecture that enables an efficient deployment, control, and management of active services. - Network services - implements Open Geospatial Consortium (OGC) standards for data retrieval (WMS, WCS, WFS) and server-side processing (WPS). - Active community - fast growing international user community. - Powerful visualizations - effective data visualization methods, suitable for analysis of big volumes of multi-temporal data. - Server-side processing services - currently the service has interfaces for the following types of geospatial processing functions: buffer, clip, resample, profile and raster algebra.
Ajoutée
Ajoutée
5D Multi-Purpose LIS (Land information System)
Agriculture, Infrastructure, Coastal, Floods, Forests, Inland Water, Land Ecosystems, Land use, Landslides, Sea-ice and icebergs, Snow & Ice, Topography, Urban Areas, Security, Assess Environmental impact of farming, Monitor crops, Assess Deforestation / Forest Degradation, Assess environmental impact of forestry, Assess and monitor water bodies   , Monitor land ecosystems and biodiversity, Monitor land cover and detect change , Baseline mapping , Map line of sight visibility (land surface), Asset infrastructure monitoring, Monitor coastal ecosystem, Monitor the coast line, Map and assess flooding, Detect and monitor wildfires, Forecast and assess landslides, Monitor sensitive risk areas, Forecasting epidemics and diseases, land administration, land use studies, monitoring of settlements, urban atlas, urban development, smart cities, rural areas, building inventory, building footprint, spatial planning, land cover, Solar energy, Construction, Forestry, Real-estate management, Transportation
The complexity of modern urban environments has led to the introduction of 3D Land Information Systems (LISs), which tend to replace traditional 2D LIS architectures for the purposes of urban planning and regeneration, land administration, real estate management and civil development. Both the need for 3D visualization of the geometry of buildings in various time instances through the years and the need for acquisition of 3D models in various levels of detail (LoDs), which not only fulfill the requirements of the various users but also they speed up the visualization process, are obvious. Thus, additional dimensions, that is, for time and scale, need to be supported by a modern LIS. This service introduces a 5D modelling pipeline that may be adopted by a multi-purpose LIS for the selective creation of 3D models of an urban area in various time instances and at various LoDs, enriched with cadastral and other spatial data. The methodology is based on automatic change detection algorithms for spatial-temporal analysis of the spatial changes that took place in subsequent time periods, using image orientation, dense image matching and structure from motion algorithms, the procedure requires photogrammetric stereo plotting, implements procedural modelling and relies on the availability of overlapping aerial and terrestrial imagery, ground control points and cadastral information.
Ajoutée
Ajoutée
Land Cover Analysis
Floods, Inland Water, Land Ecosystems, Geology, Forests, Infrastructure, Land use, Urban Areas, Fires, Earthquakes, Construction, Emergency Services, Environmental, Pollution & Climate, Farming, Utilities (water, electricity, waste) , Oil and Gas, Minerals and Mining
LCA stands for Land Cover Analysis and is used to provide an up to date, digital overview of what covers the surface of our earth split out into 10 key land cover classes. The LCA is often the first step in many environmental monitoring or site selection processes.
Ajoutée
Ajoutée